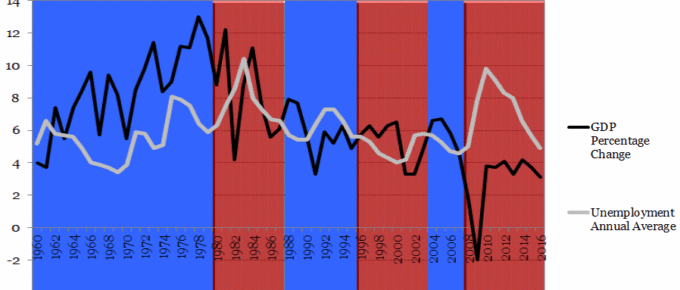
The chart shows that with the exception of 2 occasions, each time the incumbent was ousted at general election, GDP had fallen in the year prior.
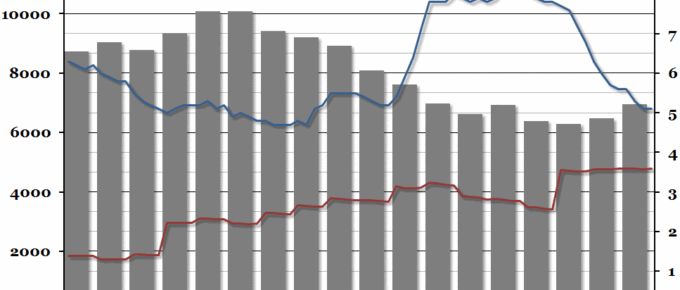
Chart of the Week: Week 35, 2016: Crime and the Economy
Despite the experience of the 1980s when crime rose sharply with unemployment, crime rates in the UK have remained static post the financial crisis despite large fluctuations in unemployment.
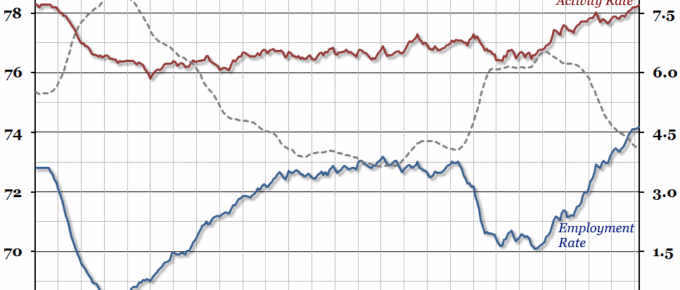
Chart of the Week: Week 20, 2016: UK Labour Market
Today’s labour market statistics (for the first quarter of the year) show that the unemployment rate remained at 5.1%, where it has been since November 2015.
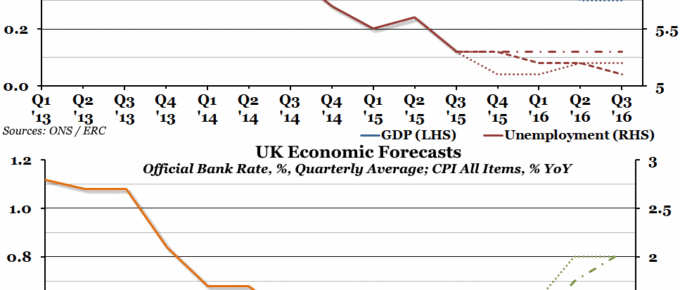
Chart of the Week: Week 49, 2015: UK Economic Forecasts
Last week, the Economic Research Council hosted our fifth annual economic forecasting event, the “Clash of the Titans”, where we invited three economic experts to give their forecasts for 2016.
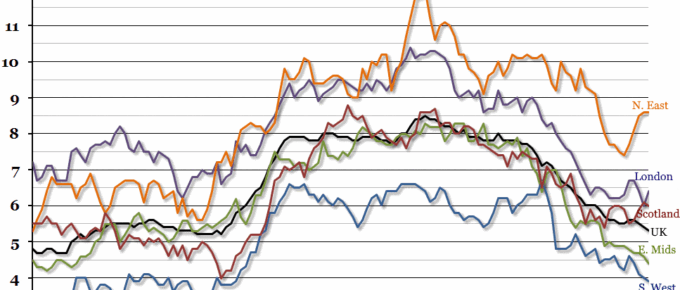
Chart of the Week: Week 45, 2015: Regional Unemployment
After a brief stutter last quarter, the UK’s headline unemployment rate continued to fall in the third quarter of the year, to 5.3% (the lowest it has been since the beginning of 2008, when it stayed at 5.2% for around six months).
Chart of the Week: Week 40, 2015: UK Workless Households
The annual study from the ONS on workless households in the UK was released yesterday, and it showed a mixed picture with total workless households continuing to fall but the number of households where nobody has ever worked growing.