The Land Registry’s data for the first quarter of the year came out recently, showing a 6.5% year-on-year growth rate in nominal prices for England and Wales, while in London, the equivalent rate was 13.8%.
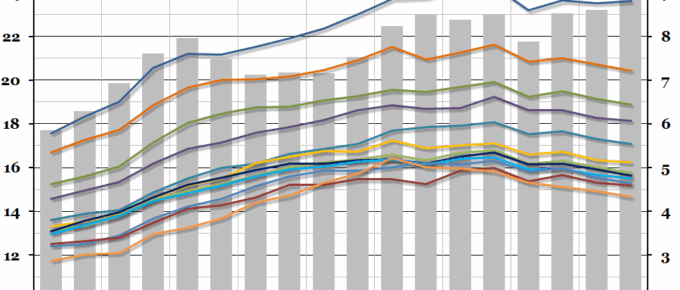
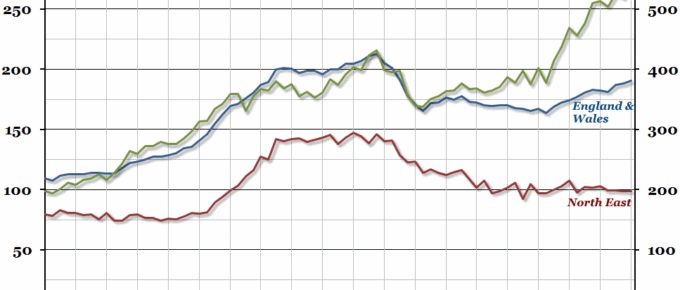
Chart of the Week: Week 21, 2016: Regional Disposable Income
Data released by the ONS this morning showed that the gap in gross disposable income between the richest region of the UK (London) and the poorest (Northern Ireland) opened up to the largest it has been since records began in 1997.
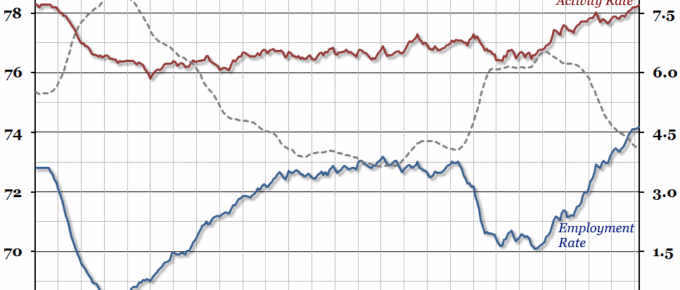
Chart of the Week: Week 20, 2016: UK Labour Market
Today’s labour market statistics (for the first quarter of the year) show that the unemployment rate remained at 5.1%, where it has been since November 2015.
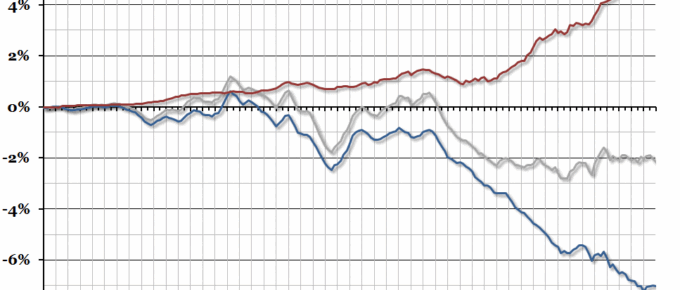
Chart of the Week: Week 19, 2016: UK Trade Balance
The UK’s trade balance statistics for the first quarter of the year were released yesterday.
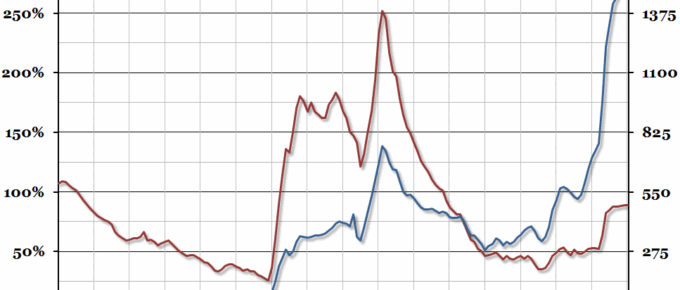
Chart of the Week: Week 18, 2016: Historical UK Government Debt
The public sector finances for the financial year 2015/16 were recently released, showing that Public Sector Net Borrowing (excluding publicly owned banks) fell to £74bn (from £91.7bn in 2014/15).
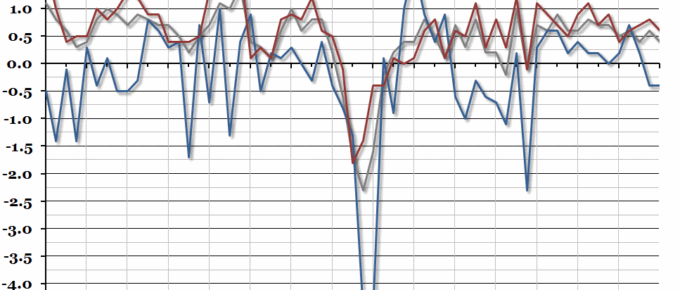
Chart of the Week: Week 17, 2016: GDP Growth by Sector
The preliminary estimate of first quarter GDP growth was released this morning, and it showed that growth had slowed at the beginning of this year to 0.4% (from 0.6% at the end of 2015).